How long should cold brew steep?
Caffeine levels off around 6–7 hours at room temperature. Dissolved solids keep climbing, and in one tasting, 14 hours beat 22.
- Caffeine and 3-CGA level off
- 6–7hSource [1]
- Extraction yield at 14 h (coarse, Huila)
- 15.21%Source [2]
- Extraction yield at 22 h (same coffee)
- 20.39%Source [2]
- Steep the tasters scored best
- 14hSource [2]
The data
Most cold brew recipes say 12 to 24 hours. A 2017 study timed it. Megan Fuller and Niny Rao steeped four versions of the same Kona coffee (two roasts, two grinds) at room temperature and sampled them all day. Caffeine and 3-CGA, the chlorogenic acid they tracked, rose fast for about three hours, slowed, and reached equilibrium between 6 and 7 hours in every sample [1].
The 24-hour readings came out a little higher than the 6.7-hour ones in every case, but the authors judged those gains not significant. In their words, brewing near 400 minutes is “adequate to extract the majority” of both compounds. For the medium roast, medium grind, 3-CGA went from 480 to 510 mg/L across those extra 17 hours.
- 6.7 h (400 min)
- 24 h (1440 min)
see the numbers
| 6.7 h (400 min) | 24 h (1440 min) | |
|---|---|---|
| Medium roast, medium grind | 1,060 | 1,180 |
| Medium roast, coarse grind | 1,130 | 1,230 |
| Dark roast, medium grind | 970 | 1,080 |
| Dark roast, coarse grind | 930 | 990 |
Re-plotted from values reported in Table 2 of source [1]. Means of 6 measurements; the paper gives ±30 to ±90 mg/L 95% confidence intervals and calls the gain after 400 minutes not significant.
Caffeine is only part of the cup, though. A 2019 study from Colombia measured total dissolved solids (strength) and extraction yield (how much of the coffee ended up in the water) at 14 and 22 hours, and both kept rising. The coarse-ground Huila went from 15.21 % to 20.39 % extraction yield in those eight hours [2].
- 14 h
- 22 h
see the numbers
| 14 h | 22 h | |
|---|---|---|
| Coarse grind, Huila | 1.54 | 2.04 |
| Coarse grind, Nariño | 1.61 | 1.96 |
| Medium grind, Huila | 0.71 | 0.94 |
| Medium grind, Nariño | 0.94 | 1.09 |
Re-plotted from values reported in Table 1 of source [2]. Brewed at 60 g coffee to 700 g water in a filter bag.
Grind moved those numbers even more than the clock did, and it gets its own file: does grind size matter?
So the extra hours do something, and the same study checked whether it was worth having. Three trained tasters scored every brew, and the best overall scores for both coffees went to coarse grind at 14 hours, not 22 [2]. The authors suggest long steeps may pull out more of the compounds behind off notes, a hypothesis they didn’t measure.
How they measured it
Fuller and Rao, 2017. 35 g of coffee in a tea filter bag, in 350 mL of filtered tap water, in a lidded Mason jar at 21–25 °C. They sampled every 15 minutes for the first hour, every 30 minutes to hour 7, hourly to hour 12, and once more at 24 hours. Caffeine and 3-CGA were measured by HPLC. Each coffee was brewed three times and each sample run twice. The full time course appears only as a figure. The paper’s table prints values at 400 minutes (6.7 hours) and 1,440 minutes (24 hours), and those are what’s re-plotted above.
Cordoba and colleagues, 2019. 60 g of coffee to 700 g of water at 20 °C, grounds in a filter bag, steeped 14 or 22 hours. Two Colombian Caturra coffees (Huila and Nariño), medium roast, at a medium and a coarse grind. Dissolved solids were calculated from a °Brix reading, and extraction yield from that. Each brew was made twice and measured in triplicate. Three trained tasters scored the cold brews at 19 °C.
What the data can’t tell you
- Room temperature only: both studies brewed at 20–25 °C. Fridge brewing is slower, and neither measured how much slower, so neither can tell you the fridge equivalent of 7 hours.
- The 6–7 hour plateau covers two molecules, caffeine and one chlorogenic acid. Flavor is hundreds of compounds, and neither study timed those.
- The full extraction curve exists only as a figure in the 2017 paper. The printed values are at 6.7 and 24 hours, so those are the only two we plot. We don't trace curves off other people's figures.
- Neither study measured total dissolved solids between 7 and 14 hours. The 2019 study starts at 14, and that gap sits right where most home recipes live.
- The timing study used one coffee (a Kona Typica from one roaster) at one ratio, and the tasting study used two Colombian coffees. Your beans may run faster or slower.
- The 14-over-22 result comes from three tasters. Trained ones, but three. Call it a good lead and nothing firmer.
- Both studies steeped grounds in a filter bag, and neither reports stirring. Loose grounds or a stir halfway may change the pace, and nobody tested it.
What to do at home
At room temperature, steep at least 7 hours so the caffeine is out. Around 14 hours is a sensible place to stop. It's what the one tasting panel preferred, and the extra hours mostly add dissolved solids. In the fridge, go longer, though nobody has measured how much longer.
Gear for this batch
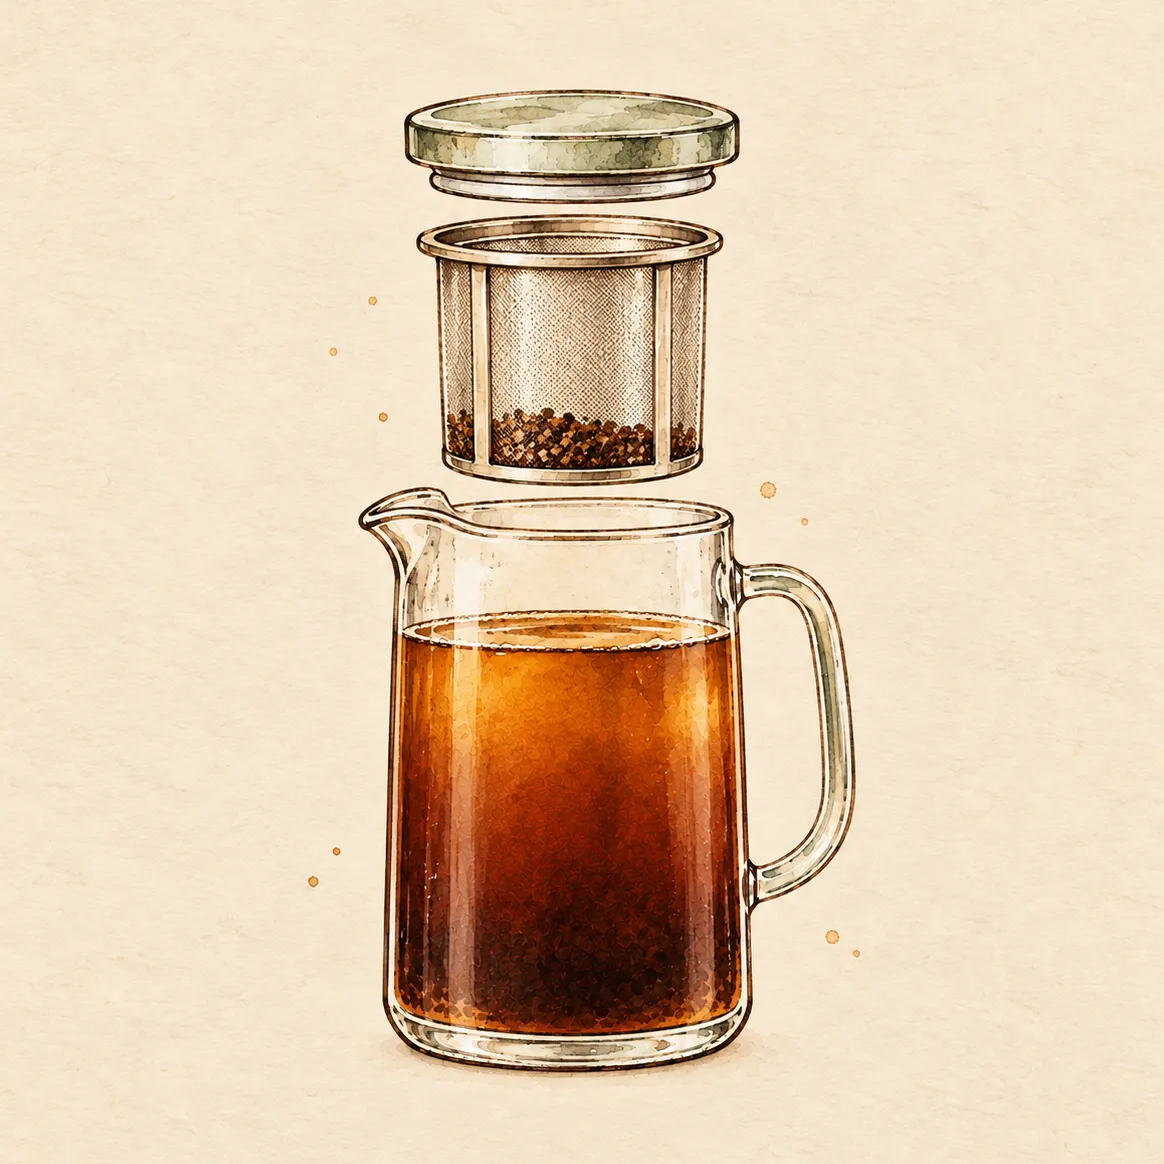
illustration Home Cold Brew System
View at toddycafe.com (opens in a new tab)illustration Good Grips Cold Brew Coffee Maker
View at oxo.com (opens in a new tab)
Sources
Fuller, M. & Rao, N. Z. (2017). The Effect of Time, Roasting Temperature, and Grind Size on Caffeine and Chlorogenic Acid Concentrations in Cold Brew Coffee. Scientific Reports 7, 17979. doi:10.1038/s41598-017-18247-4 peer-reviewed
Cordoba, N., Pataquiva, L., Osorio, C., Moreno Moreno, F. L. & Ruiz, R. Y. (2019). Effect of grinding, extraction time and type of coffee on the physicochemical and flavour characteristics of cold brew coffee. Scientific Reports 9, 8440. doi:10.1038/s41598-019-44886-w peer-reviewed
Charts on this page are re-plotted from numbers printed in the sources’ text and tables. How the Lab picks and reads its sources
Four more questions from the Lab
- Does grind size matter for cold brew?7.06 %Extraction yield, medium grind (Huila, 14 h)Cordoba et al. 2019
- What actually changes between cold brew and a French press?2.95 % TDSStrength, room-temp cold brew (23 °C, 8 h)Wang & Lim 2023
- How long does cold brew last in the fridge?<25 CFU/mLBacteria at every check, days 0–42Lopane et al. 2024
- Is cold brew actually less acidic?4.85–5.13pH, hot and cold (six coffees)Rao & Fuller 2018